CH 3 Predicting sleep state in human PD patients1
The contents of this chapter are available in Inferring sleep stage from local field potentials recorded in the subthalamic nucleus of Parkinson’s patients.2
[pdf] [Source Code]
Abstract
Parkinson’s disease (PD) is highly comorbid with sleep dysfunction. In contrast to motor symptoms, few therapeutic interventions exist to address sleep symptoms in PD. Subthalamic nucleus (STN) deep brain stimulation (DBS) treats advanced PD motor symptoms and may improve sleep architecture. As a proof of concept toward demonstrating that STN‐DBS could be used to identify sleep stages commensurate with clinician‐scored polysomnography (PSG), we developed a novel artificial neural network (ANN) that could trigger targeted stimulation in response to inferred sleep state from STN local field potentials (LFPs) recorded from implanted DBS electrodes. STN LFP recordings were collected from nine PD patients via a percutaneous cable attached to the DBS lead, during a full night’s sleep (6–8 hr) with concurrent polysomnography (PSG). We trained a feedforward neural network to prospectively identify sleep stage with PSG‐level accuracy from 30‐s epochs of LFP recordings. Our model’s sleep‐stage predictions match clinician‐identified sleep stage with a mean accuracy of 91% on held‐out epochs. Furthermore, leave‐one‐group‐out analysis also demonstrates 91% mean classification accuracy for novel subjects. These results, which classify sleep stage across a typical heterogenous sample of PD patients, may indicate spectral biomarkers for automatically scoring sleep stage in PD patients with implanted DBS devices. Further development of this model may also focus on adapting stimulation during specific sleep stages to treat targeted sleep deficits.
3.1 Introduction
Sleep is crucial to the regulation of physiological and cognitive functions in humans, and when disordered, greatly diminishes quality of life (Giuditta et al., 1995; Pace-Schott and Hobson, 2002) and adversely affects nervous system repair (Brager et al., 2016; Lucke-Wold et al., 2015). Parkinson’s disease (PD) is a neurodegenerative disorder that exhibits a high degree of comorbidity with a wide range of sleep disorders (De Cock et al., 2008; Tekriwal et al., 2017). The diagnosis and treatment of PD primarily focus on the overt motor symptoms (Postuma et al., 2015). However, there is increasing interest in understanding the impact of non-motor symptoms, such as sleep dysfunction, on overall disease burden (Chaudhuri et al., 2006), and in identifying treatments for these symptoms. With the onset of motor fluctuations or break-through tremor despite optimal medical management, subthalamic nucleus (STN) deep brain stimulation (DBS) surgery has become the gold-standard for treating the motor symptoms of advanced PD (Bronstein et al., 2011; Hamani et al., 2004). Interestingly, several studies have found that STN-DBS can improve sleep in PD (Arnulf et al., 2000; De Cock et al., 2011; Iranzo et al., 2002). In our previous work, using local field potentials (LFP) recorded from DBS electrodes implanted in STN for the treatment of PD, we identified unique spectral patterns within STN oscillatory activity that correlated with distinct sleep cycles—a finding that might offer insight into sleep dysregulation (Thompson et al., 2018). One extension of this work was to determine whether LFP information recorded from STN could be used in real-time to objectively identify sleep cycles for targeted therapy using DBS. In other words, the sleep benefit derived from STN stimulation could potentially be optimized using an adaptive stimulation algorithm that is aimed at specific sleep stages. In this study, we demonstrate the use of a feedforward artificial neural network that predicts sleep stage from LFP recordings, within STN, with high precision.
3.2 Methods
3.2.1 Patient Demographics
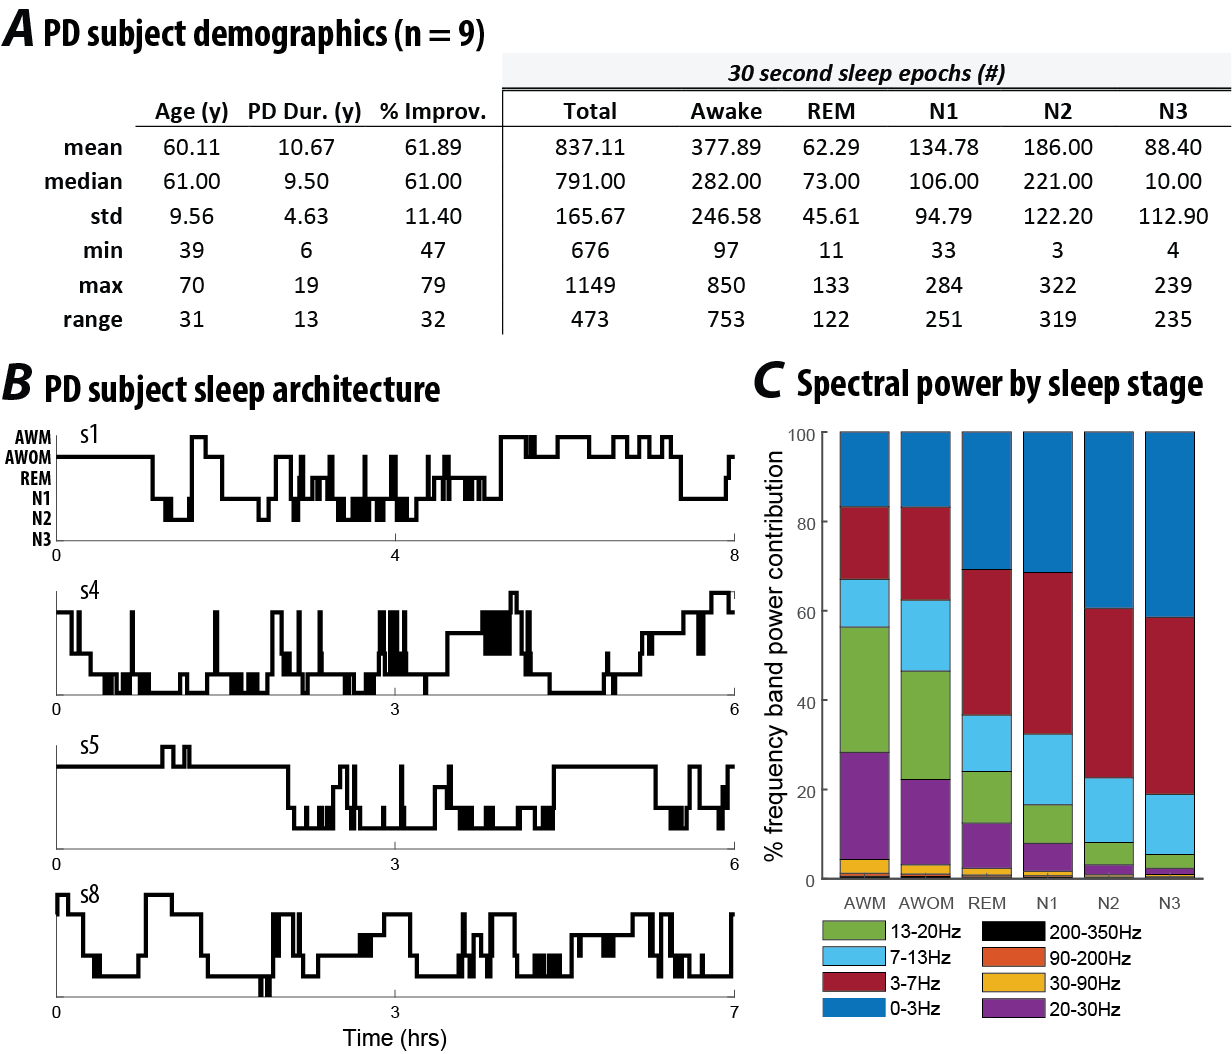
This study was approved by the Institutional Review Board of the University of Minnesota, where the surgical and recording procedures were performed. All consented study subjects (n = 9) carried a diagnosis of idiopathic PD (Figure 3.1 A). Subjects were unilaterally implanted in STN with a quadripolar DBS electrode (model #3389: Medtronic Inc., Fridley, MN), per routine surgical protocol (Abosch et al., 2012). Experimental details for the recording setup have been previously published (Thompson et al., 2018). Basic characterization of these data was previously reported in Thompson et al., 2018.

Figure 3.1: (A) Demographic data and sleep stage characteristics for Parkinson’s disease subjects participating in this study (n = 9). Percent improvement in PD reflects the change in the Unified Parkinson’s Disease Rating Scale (UPDRS) motor scale before and after DBS surgery.(B) Hypnograms from four representative subjects in this study, indicative of common sleep architecture deficits reported for individuals with PD. (C) Distribution of frequency band power contribution to sleep stage for all subjects.
3.2.2 Signal processing of local field potentials
Signal processing of the raw STN LFP signals were previously described in Thompson et al., (2018). Briefly, after preprocessing, the four LFP channels (0, 1, 2 and 3) – one recording from each of the four electrical contacts of the implant - were converted into three bipolar derivations (LFP01, LFP12 and LFP23) by sequentially referencing them. Power spectral density (PSD) was estimated using a Fast Fourier Transform from a 2 s long sliding window (Hamming) with 1 s overlap. The final time-evolving spectra had 15 s time and 0.5 Hz frequency resolution. For each subject, LFP data selected for further analysis were based on the location of the DBS electrode contact within STN and this was verified by the following: (1) intraoperative microelectrode recordings that identified cells with firing characteristics consistent with STN neurons; (2) antiparkinsonian benefit and side effects of macrostimulation; (3) preoperative stereotactic T1- and T2-weighted images merged to a postoperative MRI demonstrating the position of the DBS electrode within the borders of STN; (4) the use of Framelink (Medtronic Corp.) software to analyze DBS position on the postoperative MRI; and (5) evaluation of the efficacy of post-programming stimulation on contralateral motor symptoms for each subject (Ince et al., 2010). Selection of which contact(s) to use for study recordings was based on the STN contact(s) associated with peak beta-spectrum activity as this feature correlates with the optimal programming contact(s) for the treatment of contralateral motor symptoms (Ince et al., 2010). These criteria were used to ensure that the selected contact was most reliably in the same relative anatomical location across patients to permit generalizability of the model.
3.2.3 Video PSG Scoring
The polysomnographic electrode montage used was the following: F3–C3, P3–O1, F4–C4 and P4–O2, EOGL–A2, EOGR–A1 and chin EMG (Iber et al., 2007). Sleep stages were determined by analyzing 30 s epochs of the PSG, by a sleep neurologist, with each epoch classified as Awake or as belonging to one of the following sleep stages: rapid eye movement (REM), or the non-REM (NREM) stages of N1, N2 or N3.
3.2.4 Model Description
We trained a feedforward artificial neural network (ANN) with a single hidden layer (Fig 2B) to prospectively identify whether a given 30-second epoch of STN-LFP recording took place during one of three possible states: REM, NREM or Awake. Inputs to the model were 8 separate frequency band power bins, averaged over 30 seconds: delta (0-3 Hz), theta (3-7 Hz), alpha (7-13 Hz), low beta (13-20 Hz), high beta (20-30 Hz), and low gamma (30-90 Hz), high gamma (90-200) and high frequency oscillations (200-350). Each frequency range input feature was normalized independently by subtracting the mean and scaling by the variance of feature. The ANN output is a probability that the measured epoch occurs during one of the three possible states. Optimal ANN architecture was chosen based on hyperparameter optimization detailed below. The ANN model utilizes a single hidden layer to encode the normalized spectral power bands within 32 features by calculating weighted sums of the input frequency power and scaling them by a non-linear function. Weighted linear combinations of these 32 features are then used by the network to compute sleep state probabilities with application of a softmax nonlinearity.
3.3 Results
3.3.1 Model Performance and Validation
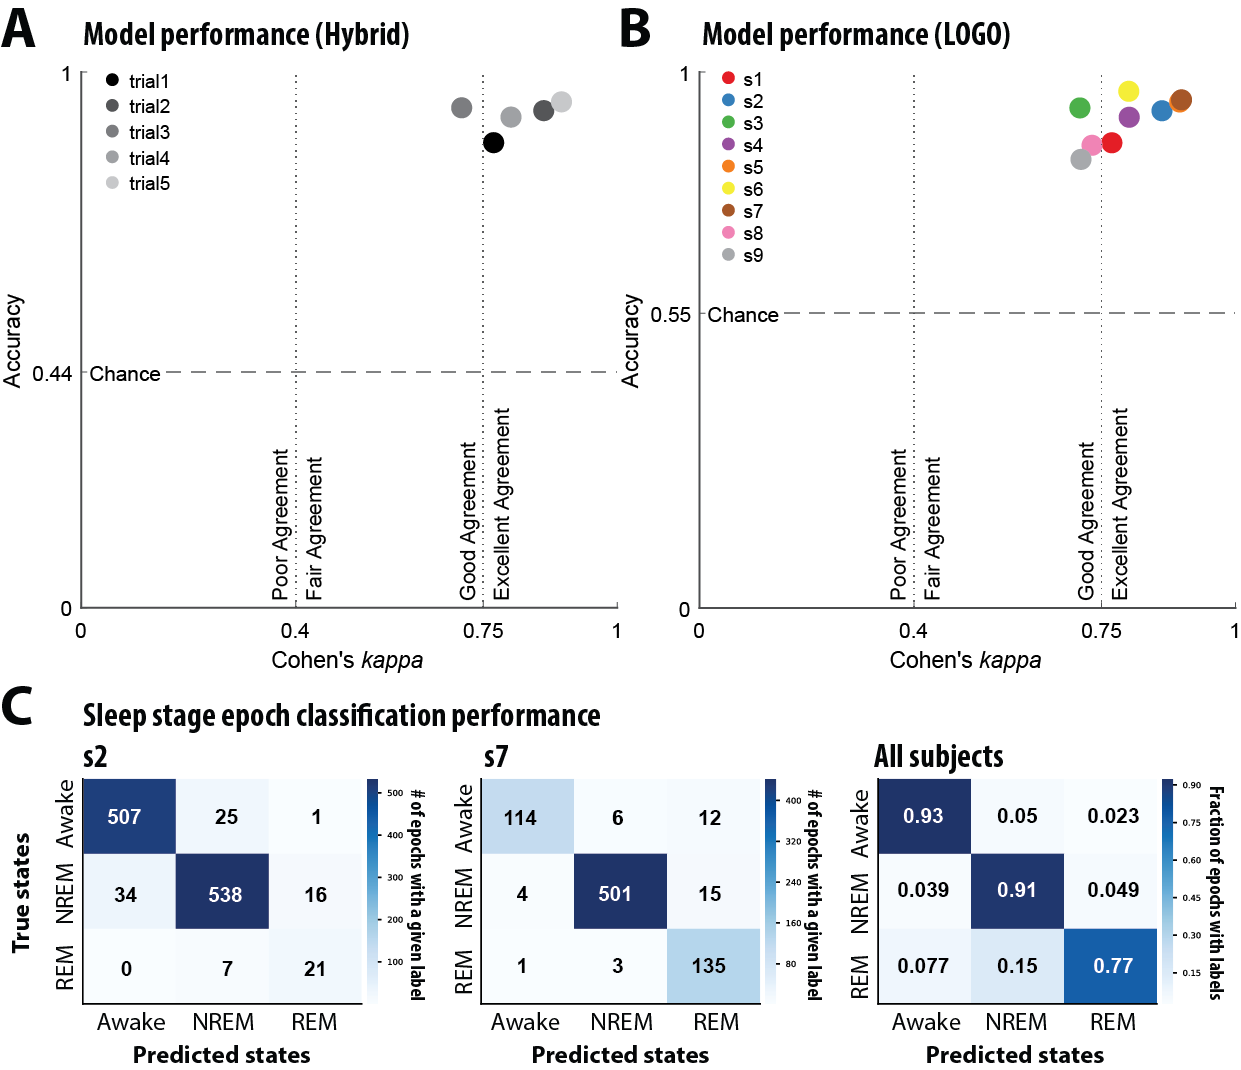
First, we tested the model’s ability to predict sleep stages on novel examples from patients included in the training set. We pooled 80% of each patient’s 30-second STN-LFP recording epochs across all 9 patients to train the model. The remaining 20% of the withheld epochs were used to evaluate the model’s performance on novel examples from familiar patients. The train-test fractions (80:20) were sampled randomly for each patient and performance was averaged in replicates of 5 to prevent sampling bias. The model was able to correctly predict sleep stage from STN-LFP epochs with mean accuracy of 91% (Fig 3.2 A).

Figure 3.2: (A) In the “hybrid” strategy a random 80% of each patient’s local field potential (LFP) recordings were pooled to train the model. Model accuracy and Cohen’s κ were evaluated on the withheld 20% from each patient. This analysis was replicated in four other random 80:20 splits to control sampling bias. Cohen’s κ magnitude guidelines derived from (Fleiss and Cohen, 1973). (B) A Leave One Group Out (LOGO) cross validation strategy was used to test generalizability to unseen patients. Each data point represents a model trained with a specific patient excluded from its training data. Model accuracy and Cohen’s κ were evaluated on data from the held-out patient. (C) Confusion matrices of representative models trained using LOGO cross validation strategy. The first two confusion matrices represent individual subjects and the final confusion matrix depicts the fraction of epochs with specific class labels for all subjects.
Training a model from scratch for each new patient is often intractable. Therefore, the model’s ability to perform well on never-seen subjects demonstrates its sensitivity to the salient spectral features of sleep across individual variations. To test this level of generalization, the model was trained on all epochs from 8 of the 9 patients. Subsequently, model performance was evaluated on all epochs from the held-out patient. Thus, nine different models were trained, each with a specific patient withheld from its training data. As above, model performance was quantified using accuracy and Cohen’s κ (Fig. 3B). Across all models, mean classification accuracy of 91% was observed. Finally, because the number of epochs of each observed sleep state varies between patients in the dataset, we produced confusion matrices for the test patient of each model and show representative examples from patients with significantly imbalanced sampling as well as summary matrix averaged across all models (Fig 3C). This demonstrates that the model’s error rate varies as a function of sleep stage representation, with less frequent stages showing a higher error rate (see Table 1).